How to Assess and Compare Your Value Using Value Curves
Relative Value
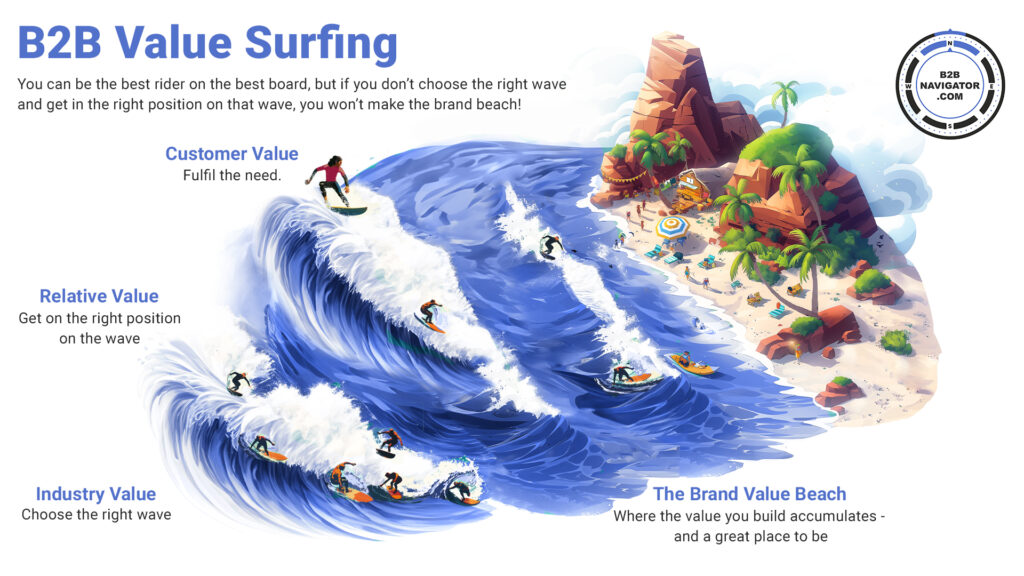
In the Value Surfing analogy we use to visualise the B2B value landscape, industry value is represented by the choice of wave, while relative value is your position on the wave. Customer value is represented by the surfboard, which conveys you towards the brand beach (brand value) as you fulfil your customer’s need. In this article, we will describe how to analyse and visualise relative value using value curves, including a step-by-step guide and a section on value estimation specifically designed for B2B tech firms.
The Challenge of Gaining Competitive Insights
Let’s get the obvious out of the way: in B2B technology markets, a good set of insights into the competitive landscape is valuable but hard to obtain. Understanding the competition makes a difference in some of the most challenging tasks in your GTM, such as identifying market opportunities, allocating resources, or improving your win rate. But in a fast-moving and often somewhat opaque market, how best to tackle it?
Why Value Curves?
After much testing, we have settled on value curves as the basis for competitive analysis.
Value curves are used to assess and visualise external, market-facing, competitive factors, resulting in strategic profiles of competing products or companies. The value curve is a valuable tool used in product category development, proposition development/adjustment and in positioning against the competition. However, they are only effective if you can estimate value effectively, which requires both a shift in perspective and the ability to calibrate value. In this article, we are going to walk through how to do this step by step.
Before we do that, it’s worth reviewing the reasons behind our selection of value curves for competitive analysis. The first and most important is that value curves provide a visual representation of the competitive landscape, representing both common and unique competitive factors and highlighting their distinctions. This allows us to map value curves to the type of demand we wish to create, from demand in a new product category to demand in a mature and highly contested existing category. The second reason is that value curves record both customer and relative value. Lastly, value curves come with a method to adjust a proposition based on what they have shown.
If the thinking sounds complex, that’s fair, but as usual with B2BNavigator.com, we break down the work into a step-by-step workflow, which is as simple as we can make it.
Origins – The Strategy Canvas
For those unfamiliar with them, Professors of Strategy Kim and Mauborgne popularised value curves in their 2005 book Blue Ocean Strategy. Here, they argued that the solution to business growth and success is to operate in an uncontested market, a blue ocean, rather than a much more competitive red ocean. To help visualise strategy and determine whether it provides unique value, Kim and Mauborgne introduced a chart, which they refer to as the strategy canvas, upon which a value curve can be plotted.
Plotting A Value Curve
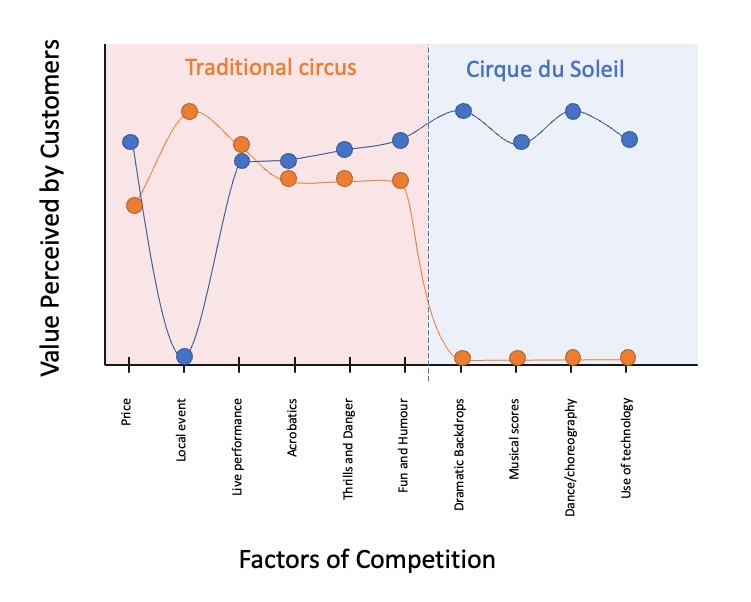
The strategy canvas consists of a two-dimensional line graph: On the horizontal axis are the characteristics of competition in the market, known as the factors of competition, such as price or other variables. The vertical axis represents the value placed on each of these factors by the customer. These are plotted on the graph as points, connected and repeated for leading alternatives, creating a value curve.
A Famous Example
Blue Ocean cited several examples, including Cirque du Soleil, a market disrupter that developed uncontested market space despite a long-term decline in the circus industry. Here’s our take on that example. To make things clearer, we’ve colour-coded the factors common to all competitors in red and those unique to Cirque du Soleil in blue.
Red and Blue Markets
B2B tech markets rarely remain uncontested for long, and it has occurred to us that the market is more of a spectrum than the binary red/blue division suggests. I first heard a good definition of that spectrum from SiriusDecisions (now Forrester) in the late 2000s with the concept of demand type and found that these definitions help to create a more nuanced red/blue value curve.
- Established Markets are mature, competitive, and often price-sensitive. They equate to the highly contested Red Markets of the Blue Ocean. When graphed, the value curve will be on the red side of the spectrum.
- New Concept addresses a problem that most buyers in the target market are not aware of. These are the uncontested markets of Blue Ocean or new product categories described in Play Bigger. The graph for a market for a new concept is shifted over the blue end of the spectrum.
- New Paradigm helps solve a known problem in the target market more effectively. This solves a known, existing problem in a new way, which is common in tech B2B markets. The value curve may contain plots in both the red and blue ends of the spectrum, but often the curve is at the red end of the spectrum with one or more points widely separated.
Competitive Analysis, Step by Step
Having reviewed the background to value curves, let’s review the steps we have adopted to effectively use them in B2B tech markets. Our competitive analysis process has five steps.
- Determine the type of competitive landscape you operate in – are you opening up a new market, disrupting an existing one with a new approach or competing in a mature market by doing something better/cheaper than the competition? The answer to this question becomes important later when you come to adjust your competitive strategy and proposition.
- Determine the factors of competition. What does the customer value that determines the type of purchase? What is important to the customer/segment, and what doesn’t matter at all? This is where a shift of perspective is essential – what is important to the customer is based on and expressed on their terms, not ours.
- Estimate the levels of each of the factors of competition to create a value curve. What value do you and the competition deliver against each of these factors? This is possibly the most challenging aspect of the analysis, but we have found two workable forms of estimation, which are described below.
- Adjust your competitive strategy and proposition based on your findings. Based on the curve, which of these factors will you eliminate, increase, or reduce? What new factors need to be created to change the game?
- If necessary, adjust the story you use to convey your value proposition. Does the existing story used by Sales and Marketing to convey your value proposition still work effectively, or does it need adjustment?
Determining the Factors of Competition
In the world of B2B technology, it can be challenging to determine the factors of competition. We’ve found it better to start with the customer’s needs rather than with the features and benefits of products and services. The easiest way to accomplish this is to break down the customer needs by stakeholders (users, finance, IT, etc.) and then decompose those into needs and requirements. If you start the other round, it is easy to descend into the depths of the feature rathole and quickly abandon the exercise!
An Example
Let’s take a brief example of the Virtual Desktop Infrastructure market. We create a table starting with a column of the stakeholders, such as users, IT Operations, IT strategy, Finance, etc., headed ‘buying lens’. In the next column, headed ‘Needs’, we break down the needs of each of these stakeholders. The needs in some of the lenses, such as IT operations and IT strategy, tend to be reasonably uniform across markets. For example, IT strategy typically requires ‘alignment with current IT strategy’ and ‘adaptability to new requirements.’
However, one or more lenses will have a very distinct profile. In the VDI market, the user lens will be quite distinct. Whilst the user needs can be expressed simply as ‘excellent user experience’, this can be further decomposed in the next column (headed which requires), which describes some specific VDI needs such as a ‘familiar, native-like desktop’. We include a second column with the same title to capture more detail at one level lower, but we are happy if we never have to use it. We complete the table with a brief description (often a feature) of how each competitor fulfils the need.
| Buying Lens | Buying Need | Which Requires (1) | Which Requires (2) | How Fulfilled (Vendor A) | How Fulfilled (Vendor B) |
| User | |||||
| IT Operations | |||||
| IT Strategy | |||||
| Finance | |||||
| Risk |
Table 1: Factors of competition breakdown
With the table complete, you are in an excellent position to ask the question, ‘What does the buyer value most?’ with your answers determining the factors of competition.
Value Estimation
As we’ve described, value curves are created by plotting the key market criteria or “factors of competition” on the horizontal axis of the graph, while the vertical axis shows the ’perceived value’ of each of these criteria. The question is, how do you estimate value? We use two methods of estimating value.
Value Estimation by Impact
The first is value delivered to the customer, which is assessed by impact on tasks, roles, processes, etc. See the table below for details. We prefer to score value (using numbers from the Fibonacci sequence, as is conventional with Agile Estimation), but assessing using T-shirt sizes can also work well.
| Value Score | T shirt Size | Extent of Impact | Value Label |
| 1 | XS | Little or none | Don’t care |
| 3 | S | Impact on tasks (outcomes, time taken etc.) | Useful |
| 5 | M | Impact on specific role(s) and/or process | Valuable |
| 8 | L | Significant impact on role(s) and/or process | Extremely valuable |
| 13 | XL | Significant impact on roles, processes to the point where the impact is considered to improve the operations of the company | Transformational |
Table 2: Scoring competitive factors based on value delivered to the customer.
Value Estimation by Investment Level
The second method is to assess where you and the competition place the most value, measured by what you invest in. This is a common method documented on the Internet.
| Value Score | T shirt Size | Extent of Investment | Value Label |
| 1 | XS | No investment | Zero investment |
| 3 | S | Minimal investment – typically at a departmental level | Small investment |
| 5 | M | Moderate investment – A large departmental investment, but still moderate at company level | Moderate investment |
| 8 | L | Significant investment – this investment is large enough to be on the radar of the CFO | Large investment |
| 13 | XL | Major investment – this is one of largest and most strategic investments the company makes | Strategic investment |
Table 3: Scoring competitive factors based on investment.
Reviewing the Canvas
Once you have plotted a value curve, you can review your market position against your competitors. Look carefully at where you offer better or worse value against the same factors. Consider where you are different and offer value that your competition does not and how this might enable you to reframe how you are considered in your product category.
Refining your Competitive Strategy and Proposition
The Four Actions Framework is another tool developed by Kim and Mauborgne for use with Blue Ocean Strategy. It is used to reprofile buyer value by adjusting and improving the value curve. The framework requires four decisions:
- Eliminate – Decide which factors taken for granted by the industry should be eliminated.
- Reduce – Decide which factors should be reduced well below the industry standard because customers are being overserved and costs are increasing unnecessarily.
- Raise – Decide which factors should be raised well above the industry’s standard.
- Create – Decide which factors not currently offered by the industry should be created – making you different, as well as better.
We frame these decisions using the questions below, substituting the term ‘Product Categories’ for ‘Industries’:
- Which factors are unique to you and make your proposition different? If you have none, consider working on your proposition to develop some unique factors.
- In which common factors in the Product Category does the competition outscore you? How can your proposition minimise the impact of this?
- Which common factors in the Product Category add little or no value and could be eliminated or de-emphasized from your proposition?
- Which common factors in the Product Category are of high value and should be emphasised in your proposition?
Competitive Strategies and Their Value Curves
Your proposition needs to work on your competitive strategy, so the work on refining it will be informed by how you intend to compete.
Here is a summary of some of the best-known competitive strategies, together with a brief description of the accompanying value curve.
- Flanking attack. A flanking attack targets areas where a competitor is weak or not present, focusing on underserved market segments, geographical regions, or aspects of the product that the competition has overlooked or neglected. The attacking competitor’s curve will spike in areas where their competition is weak.
- Frontal attack. Competitors match each other on most features. This is a competitive scenario where value curves are not helpful. Both curves will be almost identical, as each company strives to match or slightly outdo the other in every aspect.
- Differentiation strategy. A differentiation strategy involves offering products or services that stand out from competitors, creating a perception of higher value through distinctive attributes. Apple’s focus on design is part of an effective differentiation strategy. In a differentiation strategy, the value curve will show significant strengths in attributes that competitors might not offer.
- Niche strategy. Focuses on a specific, well-defined segment of the market with unique needs. The primary goal is to become a leader within this small segment. It usually involves deep specialisation and a tailored approach to meet the specific needs of a small segment, with the goal of becoming the best at serving a particular niche. The value curve may show little or no value delivered against factors that are considered unimportant or less important in the chosen segment.
- Co-operative strategy. This strategy is based on a combined offering based on a partnership with another, usually larger and better-known company, to enhance the offering. The value curve will show superior value for the combined offering on selected factors compared to independent competitors.
- Cost Leadership. Cost leadership is established when a company successfully projects itself as the lowest-cost manufacturer or provider of a particular product or service. To sustain this, a supporting strategy will need to be created, such as reducing quality to ‘good enough’ or taking a lower-cost route to market. The value curve will reflect both the difference in cost and the factors that support it.
- Blue Ocean Strategy. This strategy seeks to create a new, uncontested market space, making the competition largely irrelevant. The value curve will feature a set of value attributes at the blue end of the spectrum, where the competition is unable to deliver.
Conclusion
The main advantage of value curves is how easy they are to read. They are both simple and visual, which makes decision-making easier. The challenge in the B2B tech markets is the complexity of the factors of competition and the difficulty in estimating value. We’ve persevered and found that the approaches we’ve described here are helpful, but no doubt there are others. Please let us know if you have discovered alternatives or enhancements!